Web Server Statistics for amardonation.trialrr.com
Program started on Thu, Feb 24 2022 at 5:29 AM.
Analyzed requests from Sun, Jan 16 2022 at 12:39 AM to Wed, Feb 23 2022 at 7:32 PM (38.79 days).
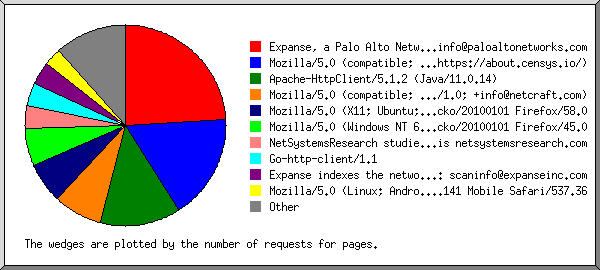
 ) represents 1 request for a page.
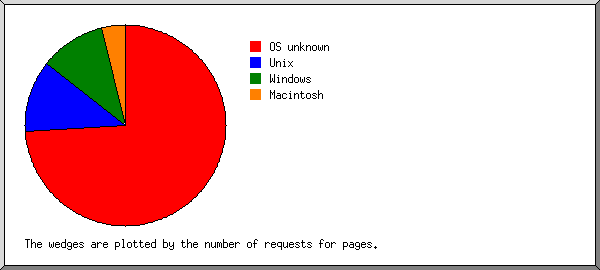