 Web Server Statistics for ajkerdin.trialrr.com
Program started on Mon, Mar 28 2022 at 5:22 AM.
Analyzed requests from Sun, Jan 16 2022 at 1:06 AM to Sun, Mar 27 2022 at 9:31 AM (70.35 days).
Web Server Statistics for ajkerdin.trialrr.comProgram started on Mon, Mar 28 2022 at 5:22 AM.
Analyzed requests from Sun, Jan 16 2022 at 1:06 AM to Sun, Mar 27 2022 at 9:31 AM (70.35 days).
(Go To: Top | General Summary | Monthly Report | Daily Summary | Hourly Summary | Domain Report | Organization Report | Browser Report | Browser Summary | Operating System Report | Status Code Report | File Size Report | File Type Report | Directory Report | Request Report)
Figures in parentheses refer to the 7-day period ending Mar 28 2022 at 5:22 AM.
Successful requests: 77 (4)
Average successful requests per day: 1 (0)
Successful requests for pages: 73 (4)
Average successful requests for pages per day: 1 (0)
Failed requests: 3 (0)
Distinct files requested: 7 (8)
Distinct hosts served: 40 (40)
Data transferred: 4.03 megabytes (233.05 kilobytes)
Average data transferred per day: 58.60 kilobytes (33.29 kilobytes)
(Go To: Top | General Summary | Monthly Report | Daily Summary | Hourly Summary | Domain Report | Organization Report | Browser Report | Browser Summary | Operating System Report | Status Code Report | File Size Report | File Type Report | Directory Report | Request Report)
Each unit ( ) represents 1 request for a page.
| month | #reqs | #pages | |
|---|---|---|---|
| Jan 2022 | 26 | 22 |    |
| Feb 2022 | 38 | 38 |  |
| Mar 2022 | 13 | 13 |  |
Busiest month: Feb 2022 (38 requests for pages).
(Go To: Top | General Summary | Monthly Report | Daily Summary | Hourly Summary | Domain Report | Organization Report | Browser Report | Browser Summary | Operating System Report | Status Code Report | File Size Report | File Type Report | Directory Report | Request Report)
Each unit () represents 1 request for a page.
| day | #reqs | #pages | |
|---|---|---|---|
| Sun | 13 | 11 | |
| Mon | 15 | 15 | |
| Tue | 20 | 18 | |
| Wed | 7 | 7 | |
| Thu | 6 | 6 | |
| Fri | 6 | 6 | |
| Sat | 10 | 10 | |
(Go To: Top | General Summary | Monthly Report | Daily Summary | Hourly Summary | Domain Report | Organization Report | Browser Report | Browser Summary | Operating System Report | Status Code Report | File Size Report | File Type Report | Directory Report | Request Report)
Each unit () represents 1 request for a page.
| hour | #reqs | #pages | |
|---|---|---|---|
| 0 | 3 | 3 | |
| 1 | 6 | 6 | |
| 2 | 5 | 5 | |
| 3 | 4 | 2 | |
| 4 | 3 | 3 | |
| 5 | 2 | 2 | |
| 6 | 1 | 1 | |
| 7 | 5 | 5 | |
| 8 | 3 | 3 | |
| 9 | 3 | 3 | |
| 10 | 0 | 0 | |
| 11 | 2 | 2 | |
| 12 | 3 | 3 | |
| 13 | 4 | 4 | |
| 14 | 6 | 4 | |
| 15 | 1 | 1 | |
| 16 | 2 | 2 | |
| 17 | 2 | 2 | |
| 18 | 4 | 4 | |
| 19 | 6 | 6 | |
| 20 | 2 | 2 | |
| 21 | 5 | 5 | |
| 22 | 1 | 1 | |
| 23 | 4 | 4 | |
(Go To: Top | General Summary | Monthly Report | Daily Summary | Hourly Summary | Domain Report | Organization Report | Browser Report | Browser Summary | Operating System Report | Status Code Report | File Size Report | File Type Report | Directory Report | Request Report)
Listing domains, sorted by the amount of traffic.
| #reqs | %bytes | domain |
|---|---|---|
| 77 | 100% | [unresolved numerical addresses] |
(Go To: Top | General Summary | Monthly Report | Daily Summary | Hourly Summary | Domain Report | Organization Report | Browser Report | Browser Summary | Operating System Report | Status Code Report | File Size Report | File Type Report | Directory Report | Request Report)

Listing organizations, sorted by the number of requests.
| #reqs | %bytes | organization |
|---|---|---|
| 28 | 39.57% | 18 |
| 10 | 14.13% | 34 |
| 8 | 6.70% | 44 |
| 7 | 9.89% | 51 |
| 6 | 8.48% | 92 |
| 5 | 5.67% | 162.142 |
| 3 | 4.24% | 167.248 |
| 2 | 2.83% | 61.164 |
| 2 | 1.43% | 167.94 |
| 1 | 1.41% | 144.91 |
| 1 | 1.41% | 64.225 |
| 1 | 3 | |
| 1 | 1.41% | 159.89 |
| 1 | 1.41% | 167.99 |
| 1 | 1.41% | 165.22 |
(Go To: Top | General Summary | Monthly Report | Daily Summary | Hourly Summary | Domain Report | Organization Report | Browser Report | Browser Summary | Operating System Report | Status Code Report | File Size Report | File Type Report | Directory Report | Request Report)
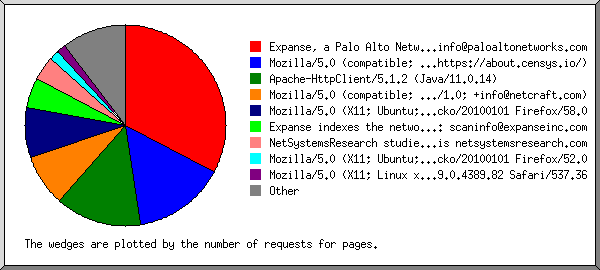
Listing browsers with at least 1 request for a page, sorted by the number of requests for pages.
| #reqs | #pages | browser |
|---|---|---|
| 28 | 28 | Apache-HttpClient/5.1.2 (Java/11.0.14) |
| 10 | 10 | Expanse indexes the network perimeters of our customers. If you have any questions or concerns, please reach out to: scaninfo@expanseinc.com |
| 10 | 10 | Mozilla/5.0 (compatible; CensysInspect/1.1; +https://about.censys.io/) |
| 6 | 6 | NetSystemsResearch studies the availability of various services across the internet. Our website is netsystemsresearch.com |
| 4 | 4 | Mozilla/5.0 (compatible; NetcraftSurveyAgent/1.0; +info@netcraft.com) |
| 4 | 4 | Mozilla/5.0 (X11; Ubuntu; Linux x86_64; rv:58.0) Gecko/20100101 Firefox/58.0 |
| 7 | 3 | Mozilla/5.0 (X11; Ubuntu; Linux x86_64; rv:52.0) Gecko/20100101 Firefox/52.0 |
| 2 | 2 | Mozilla/5.0 (Windows NT 10.0; Win64; x64) AppleWebKit/537.36 (KHTML, like Gecko) Chrome/63.0.3239.108 Safari/537.36 |
| 1 | 1 | Mozilla/5.0 (Windows NT 10.0; Win64; x64; rv:91.0) Gecko/20100101 Firefox/91.0 |
| 1 | 1 | Mozilla/5.0 (X11; Linux x86_64) AppleWebKit/537.36 (KHTML, like Gecko) Chrome/89.0.4389.82 Safari/537.36 |
| 1 | 1 | Mozilla/5.0 (Windows NT 10.0; Win64; x64) AppleWebKit/537.36 (KHTML, like Gecko) Chrome/92.0.4515.107 Safari/537.36 |
(Go To: Top | General Summary | Monthly Report | Daily Summary | Hourly Summary | Domain Report | Organization Report | Browser Report | Browser Summary | Operating System Report | Status Code Report | File Size Report | File Type Report | Directory Report | Request Report)
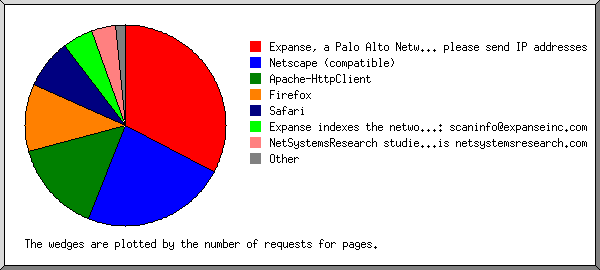
Listing browsers with at least 1 request for a page, sorted by the number of requests for pages.
| # | #reqs | #pages | browser |
|---|---|---|---|
| 1 | 28 | 28 | Apache-HttpClient |
| 28 | 28 | Apache-HttpClient/5 | |
| 2 | 14 | 14 | Netscape (compatible) |
| 3 | 10 | 10 | Expanse indexes the network perimeters of our customers. If you have any questions or concerns, please reach out to: scaninfo@expanseinc.com |
| 4 | 12 | 8 | Firefox |
| 4 | 4 | Firefox/58 | |
| 7 | 3 | Firefox/52 | |
| 1 | 1 | Firefox/91 | |
| 5 | 6 | 6 | NetSystemsResearch studies the availability of various services across the internet. Our website is netsystemsresearch.com |
| 6 | 4 | 4 | Safari |
| 4 | 4 | Safari/537 |
(Go To: Top | General Summary | Monthly Report | Daily Summary | Hourly Summary | Domain Report | Organization Report | Browser Report | Browser Summary | Operating System Report | Status Code Report | File Size Report | File Type Report | Directory Report | Request Report)

Listing operating systems, sorted by the number of requests for pages.
| # | #reqs | #pages | OS |
|---|---|---|---|
| 1 | 58 | 58 | OS unknown |
| 2 | 12 | 8 | Unix |
| 12 | 8 | Linux | |
| 3 | 4 | 4 | Windows |
| 4 | 4 | Windows NT |
(Go To: Top | General Summary | Monthly Report | Daily Summary | Hourly Summary | Domain Report | Organization Report | Browser Report | Browser Summary | Operating System Report | Status Code Report | File Size Report | File Type Report | Directory Report | Request Report)
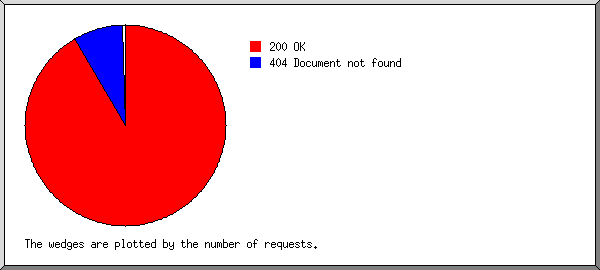
Listing status codes, sorted numerically.
| #reqs | status code |
|---|---|
| 77 | 200 OK |
| 3 | 404 Document not found |
(Go To: Top | General Summary | Monthly Report | Daily Summary | Hourly Summary | Domain Report | Organization Report | Browser Report | Browser Summary | Operating System Report | Status Code Report | File Size Report | File Type Report | Directory Report | Request Report)
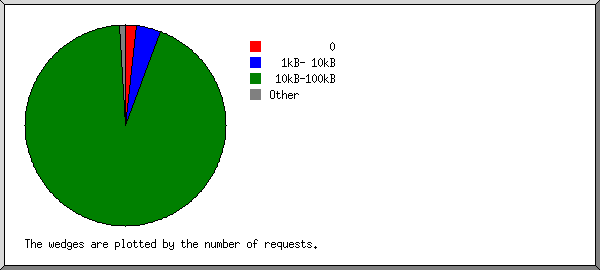
| size | #reqs | %bytes |
|---|---|---|
| 0 | 1 | |
| 1B- 10B | 0 | |
| 11B- 100B | 0 | |
| 101B- 1kB | 2 | 0.03% |
| 1kB- 10kB | 2 | 0.42% |
| 10kB-100kB | 72 | 99.55% |
(Go To: Top | General Summary | Monthly Report | Daily Summary | Hourly Summary | Domain Report | Organization Report | Browser Report | Browser Summary | Operating System Report | Status Code Report | File Size Report | File Type Report | Directory Report | Request Report)
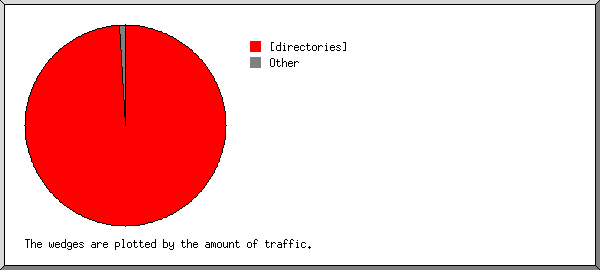
Listing extensions with at least 0.1% of the traffic, sorted by the amount of traffic.
| #reqs | %bytes | extension |
|---|---|---|
| 73 | 98.96% | [directories] |
| 4 | 1.04% | .png [PNG graphics] |
(Go To: Top | General Summary | Monthly Report | Daily Summary | Hourly Summary | Domain Report | Organization Report | Browser Report | Browser Summary | Operating System Report | Status Code Report | File Size Report | File Type Report | Directory Report | Request Report)

Listing directories with at least 0.01% of the traffic, sorted by the amount of traffic.
| #reqs | %bytes | directory |
|---|---|---|
| 73 | 98.96% | [root directory] |
| 4 | 1.04% | /assets/ |
(Go To: Top | General Summary | Monthly Report | Daily Summary | Hourly Summary | Domain Report | Organization Report | Browser Report | Browser Summary | Operating System Report | Status Code Report | File Size Report | File Type Report | Directory Report | Request Report)

Listing files with at least 20 requests, sorted by the number of requests.
| #reqs | %bytes | last time | file |
|---|---|---|---|
| 73 | 98.96% | Mar/27/22 9:31 AM | / |
| 29 | 39.57% | Mar/27/22 9:31 AM | /?34.77.162.18 |
| 4 | 1.04% | Jan/18/22 3:08 AM | [not listed: 2 files] |