(Go To: Top | General Summary | Monthly Report | Daily Summary | Hourly Summary | Domain Report | Organization Report | Browser Report | Browser Summary | Operating System Report | Status Code Report | File Size Report | File Type Report | Directory Report | Request Report)
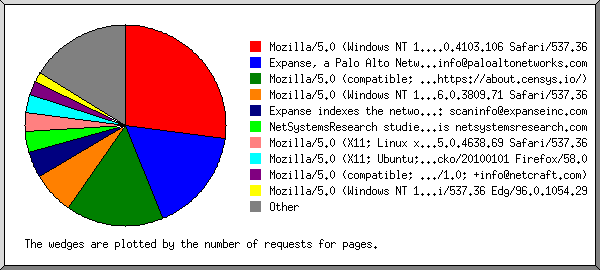
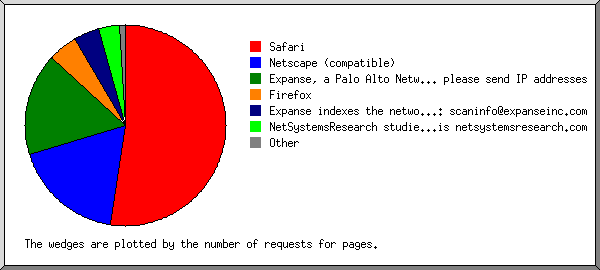
Listing browsers with at least 1 request for a page, sorted by the number of requests for pages.
| #reqs | #pages | browser |
|---|
| 116 | 60 | Mozilla/5.0 (Windows NT 10.0; WOW64) AppleWebKit/537.36 (KHTML, like Gecko) Chrome/83.0.4103.106 Safari/537.36 |
| 10 | 10 | Expanse indexes the network perimeters of our customers. If you have any questions or concerns, please reach out to: scaninfo@expanseinc.com |
| 8 | 8 | Mozilla/5.0 (compatible; CensysInspect/1.1; +https://about.censys.io/) |
| 61 | 7 | Mozilla/5.0 (X11; Linux x86_64) AppleWebKit/537.36 (KHTML, like Gecko) Chrome/95.0.4638.69 Safari/537.36 |
| 6 | 6 | NetSystemsResearch studies the availability of various services across the internet. Our website is netsystemsresearch.com |
| 54 | 4 | Mozilla/5.0 (Windows NT 10.0; Win64; x64) AppleWebKit/537.36 (KHTML, like Gecko) Chrome/95.0.4638.69 Safari/537.36 |
| 44 | 3 | Mozilla/5.0 (Windows NT 10.0; Win64; x64) AppleWebKit/537.36 (KHTML, like Gecko) Chrome/96.0.4664.45 Safari/537.36 Edg/96.0.1054.29 |
| 49 | 3 | Mozilla/5.0 (Windows NT 10.0; rv:91.0) Gecko/20100101 Firefox/91.0 |
| 51 | 2 | Mozilla/5.0 (Macintosh; Intel Mac OS X 10_15_7) AppleWebKit/605.1.15 (KHTML, like Gecko) Version/15.0 Safari/605.1.15 |
| 51 | 2 | Mozilla/5.0 (Windows NT 10.0; Win64; x64) AppleWebKit/537.36 (KHTML, like Gecko) Chrome/94.0.4606.81 Safari/537.36 OPR/80.0.4170.63 |
| 1 | 1 | Mozilla/5.0 (X11; Ubuntu; Linux x86_64; rv:58.0) Gecko/20100101 Firefox/58.0 |
| 46 | 1 | Mozilla/5.0 (Macintosh; Intel Mac OS X 10_15_7) AppleWebKit/537.36 (KHTML, like Gecko) Chrome/96.0.4664.55 Safari/537.36 |
| 6 | 0 | [not listed: 2 browsers] |
(Go To: Top | General Summary | Monthly Report | Daily Summary | Hourly Summary | Domain Report | Organization Report | Browser Report | Browser Summary | Operating System Report | Status Code Report | File Size Report | File Type Report | Directory Report | Request Report)
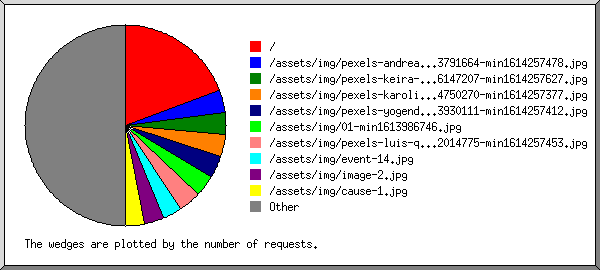
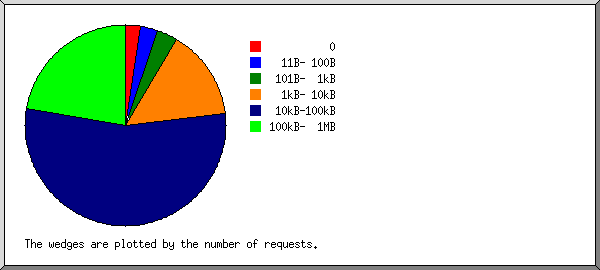
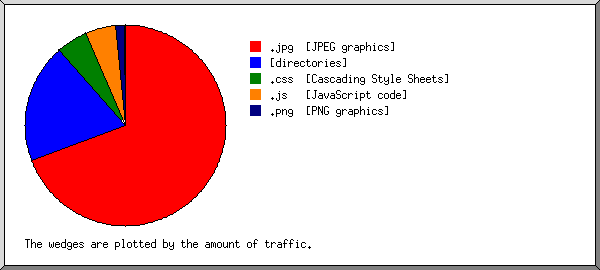
Listing files with at least 20 requests, sorted by the number of requests.
| #reqs | %bytes | last time | file |
|---|
| 107 | 14.96% | Mar/25/22 9:52 AM | / |
| 21 | 1.75% | Mar/25/22 9:52 AM | /?34.96.130.31 |
| 26 | 10.62% | Mar/ 3/22 9:30 PM | /assets/img/event-14.jpg |
| 26 | 0.33% | Mar/ 3/22 9:30 PM | /assets/img/logo.png |
| 26 | 9.51% | Mar/ 3/22 9:30 PM | /assets/img/pexels-andrea-piacquadio-3791664-min1614257478.jpg |
| 26 | 2.17% | Mar/ 3/22 9:30 PM | /assets/img/cause-7.jpg |
| 26 | 10.31% | Mar/ 3/22 9:30 PM | /assets/img/pexels-yogendra-singh-3930111-min1614257412.jpg |
| 26 | 6.37% | Mar/ 3/22 9:30 PM | /assets/img/image-2.jpg |
| 26 | 11.36% | Mar/ 3/22 9:30 PM | /assets/img/pexels-keira-burton-6147207-min1614257627.jpg |
| 26 | 1.43% | Mar/ 3/22 9:30 PM | /assets/img/banner-img.png |
| 26 | 1.16% | Mar/ 3/22 9:30 PM | /assets/img/01-min1613986746.jpg |
| 26 | 7.92% | Mar/ 3/22 9:30 PM | /assets/img/pexels-luis-quintero-2014775-min1614257453.jpg |
| 26 | 13.71% | Mar/ 3/22 9:30 PM | /assets/img/pexels-karolina-grabowska-4750270-min1614257377.jpg |
| 26 | 3.38% | Mar/ 3/22 9:30 PM | /assets/img/cause-1.jpg |
| 26 | 2.46% | Mar/ 3/22 9:30 PM | /assets/img/cause-2.jpg |
| 26 | 2.46% | Mar/ 3/22 9:30 PM | /assets/img/cause-3.jpg |
| 26 | 1.85% | Mar/ 3/22 9:30 PM | /assets/img/cause-5.jpg |
| 6 | | Jan/16/22 12:38 AM | [not listed: 3 files] |
 Web Server Statistics for amardonation.trialrr.com
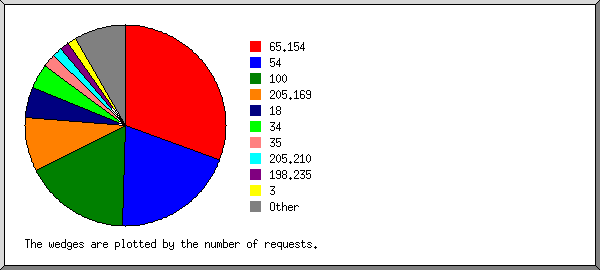
 ) represents 2 requests for pages or part thereof.